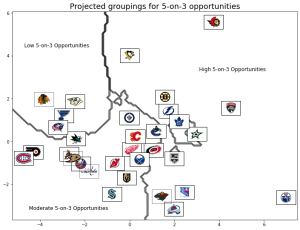
During the 2021-22 NHL season, the Toronto Maple Leafs were awarded 11 five-on-three power play opportunities, ranking 8th in the league. However, in the current 2022-23 NHL season, the Leafs had been awarded just one five-on-three power play on game 71 against the Florida Panthers, in which they scored, placing them dead last in the league. That’s a 90.9% decline in five-on-three opportunities.
What makes this statistic even more peculiar is that the average number of five-on-three opportunities across the league had actually risen by 8.99%, and the median had risen by 12.5% for the 2022-23 season.
Many fans and commentators have noticed this unusual trend, and sentiment is widespread that it is indeed an anomaly.
It took 71 games, but finally the Leafs have been awarded a 5-on-3.
Ridiculous.
— Nick Alberga (@thegoldenmuzzy) March 24, 2023
31 NHL teams have had at least three 5-on-3 opportunities this season.
The Leafs have had ZERO.
— Leafs Updates (0-0) (@LeafsUpdates21) March 17, 2023
The Leafs cannot get a 5-on-3 to save their lives
— Kevin Papetti (@KPapetti) March 3, 2023
No call on a blatant hold. Leafs never get a 5-on-3 streak is still secure!!
— BrianBeLeafs (@BrianBeLeafs) January 26, 2023
It is plausible that this discrepancy is simply an outlier due to circumstantial factors, or it may suggest that the Leafs are being affected by bias.
Bias exists in various aspects of society. But instead of proving or disproving bias or outliers, in my analysis I aimed to examine whether statistics can provide evidence of statistical justification for the Maple Leafs’ lack of five-on-three opportunities.
To investigate this, I collected over 100 separate statistics for the 2022-23 season from both NHL.com and moneypuck.com, specifically focusing on five-on-four opportunities.
My hypothesis is that teams with similar statistics should have similar outcomes. With a sample size of 82 games in a season, we should be able to identify commonalities between teams and use these outcomes to make predictions.
To identify these commonalities, I employed a clustering model, excluding the Leafs from the training and testing of the model, as they were deemed a possible outlier.
The next step was to determine the parameters and relevant statistics, or features, to be used in the model as well as normalizing the number of five-on-three opportunities into ranges.
From over a hundred features in the dataset for five-on-four opportunities, the most relevant and impactful statistics narrow down to the following:
- PP Goal Differential
- Goals Against
- % of Shot Attempts For That Are Blocked
- Expected % of Unblocked Shot Attempts For That Miss Net
- Save % Above Expected On Unblocked Shots
- Goals Differential Per 60
- Expected Goal Differential Per 60
- Shots On Goal For
- Unblocked Shots Attempts For
- Unblocked Shots Attempts Against
- Score & Flurry Adjusted Expected Goals %
- High Danger Shots For
- Medium Danger Shots For
- Low Danger Shots For
- High Danger Shots Against
- Medium Danger Shots Against
- Shots Blocked
- Hits Taken
- % of Hits Given
- Overtime Losses
After careful analysis using a combination of unsupervised machine learning, statistical analysis, and data observation, two to three clusters of teams were identified. I opted to go with three to provide a better understanding of the data. The determined ranges for the clusters were as follows:
- Low Five-On-Three Opportunities: 0 to 5
- Moderate Five-On-Three Opportunities: 6 to 8
- High Five-On-Three Opportunities: 9-plus
The accuracy of the model was tested at 90%.
When all teams, including the Toronto Maple Leafs, were plugged back into the model, it predicted that the Maple Leafs should have had 9-plus five-on-three power plays.
| Team | Predicted Range | 5-on-3 Opp |
| EDM (2022/2023): | 9+ | Actual: 10 |
| COL (2022/2023): | 9+ | Actual: 10 |
| NYR (2022/2023): | 9+ | Actual: 9 |
| SEA (2022/2023): | 6-8 | Actual: 8 |
| LAK (2022/2023): | 9+ | Actual: 10 |
| DAL (2022/2023): | 6-8 | Actual: 8 |
| MIN (2022/2023): | 9+ | Actual: 18 |
| FLA (2022/2023): | 9+ | Actual: 9 |
| DET (2022/2023): | 6-8 | Actual: 7 |
| CAR (2022/2023): | 9+ | Actual: 10 |
| VAN (2022/2023): | 6-8 | Actual: 6 |
| NJD (2022/2023): | 6-8 | Actual: 8 |
| VGK (2022/2023): | 6-8 | Actual: 6 |
| NYI (2022/2023): | 6-8 | Actual: 5 |
| WSH (2022/2023): | 6-8 | Actual: 7 |
| TBL (2022/2023): | 9+ | Actual: 12 |
| TOR (2022/2023): | 9+ | Actual: 1 |
| BUF (2022/2023): | 9+ | Actual: 12 |
| BOS (2022/2023): | 9+ | Actual: 10 |
| CGY (2022/2023): | 6-8 | Actual: 6 |
| WPG (2022/2023): | 9+ | Actual: 14 |
| OTT (2022/2023): | 9+ | Actual: 12 |
| ARI (2022/2023): | 6-8 | Actual: 8 |
| SJS (2022/2023): | 0-5 | Actual: 4 |
| ANA (2022/2023): | 6-8 | Actual: 6 |
| PHI (2022/2023): | 6-8 | Actual: 8 |
| PIT (2022/2023): | 6-8 | Actual:12 |
| STL (2022/2023): | 0-5 | Actual: 5 |
| NSH (2022/2023): | 0-5 | Actual: 5 |
| MTL (2022/2023): | 6-8 | Actual: 5 |
| CBJ (2022/2023): | 6-8 | Actual: 6 |
| CHI (2022/2023): | 0-5 | Actual:10 |
 |
| Dimensionality reduction is applied to the features used to predict outcomes. Three distinct clusters are observed and statistically similar teams for five-on-four power plays are clustered together. |
Comparison of the model’s predictions with the actual number of five-on-three opportunities awarded to other teams showed that the model was fairly accurate in its predictions for most teams, including Edmonton, Colorado, New York Rangers, Los Angeles, Dallas, Minnesota, Florida, Detroit, Carolina, Vancouver, New Jersey, Vegas, New York Islanders, Washington, Tampa Bay, Buffalo, Boston, Calgary, Winnipeg, Ottawa, Arizona, San Jose, Anaheim, Philadelphia, and Pittsburgh.
But the model’s prediction for the Toronto Maple Leafs was significantly different from the actual number of opportunities they were awarded, which was only one.
This suggests that there may be other factors influencing the Leafs’ lack of five-on-three opportunities, but further investigation is required to determine these factors.

